|
B arry's
Tire
Tech This is a series of articles on the technical aspects of tires, their care and usage. My primary purpose in these articles is to help people understand tires and thereby reduce the risks we all face every day. ..........and since tires is just about the only thing I know about.......... Please drop me a note if you have a topic you want to see: Barry@BarrysTireTech.com |
|
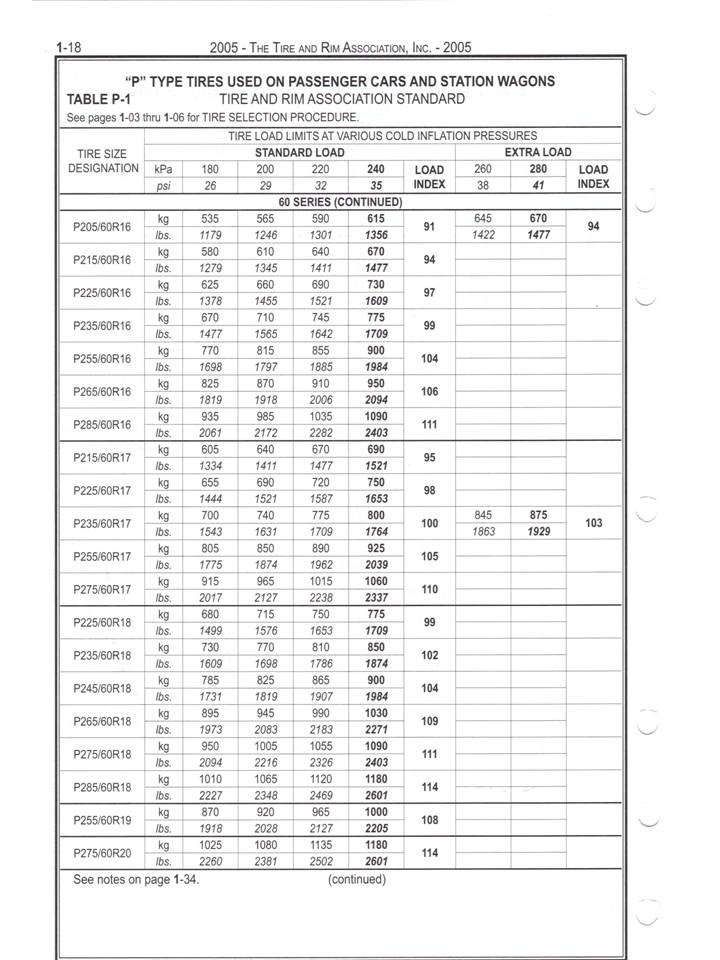
Tire Load Tables: If you haven't read up on Tire Standardizing Organizations, I suggest you do so. It will help you understand this page better: Barry's Tire Tech - Tire Standardizing Organizations Below is a scan from the 2005 Tire and Rim Association Yearbook. It is a randomly selected page. |
|
I know, I know.....It's hard to read. So print it out, already!! Notice that the layout is basically a tire size designation with an inflation pressure vs load carrying capacity chart. The dimensions are both English units and SI (metric) units. In this case, the English units are the exact units and the SI (metric) units are a conversion with rounding. You have to remember this if you are comparing TRA load tables with ETRTO and JATMA tables as those 2 are both SI (metric) only units. We commonly refer to this load / inflation pressure relationship as the "load curve". While the following may be obvious to the experienced tire guy, for those that aren't:
|
|
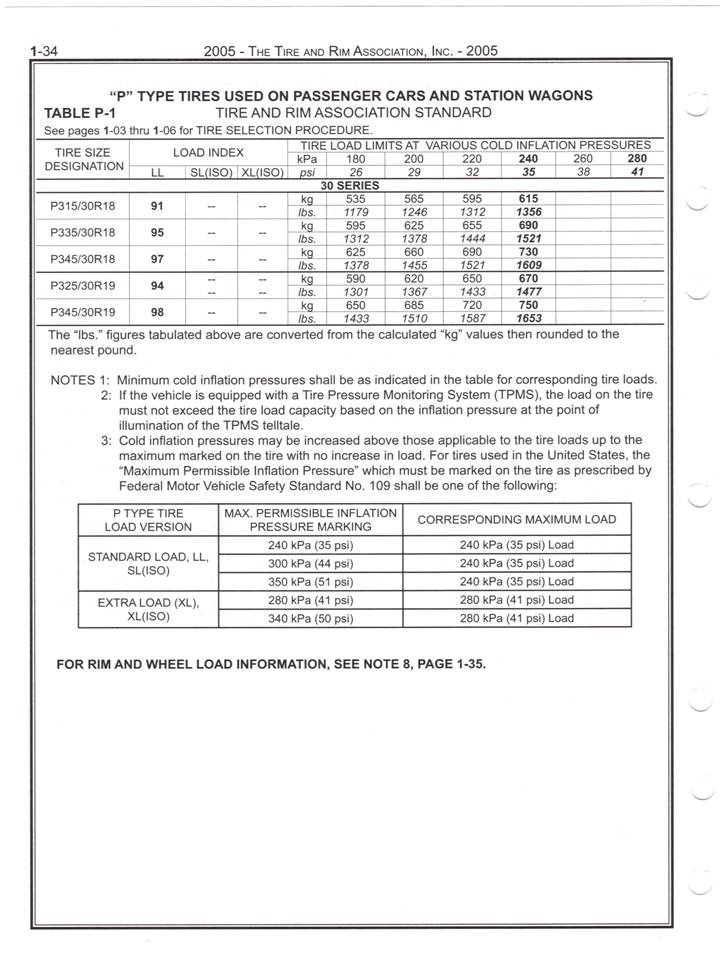
Please note that most of the table ends at 35 psi - and this is labeled "Standard Load" - but some of the tire sizes have extensions to the table, and that is labeled "Extra Load" Extra Load tires have the same physical dimensions as Standard Load tires (commonly abbreviated "SL"), but have higher load carrying capacities due to the higher pressures, and are constructed with slightly stronger materials to accommodate the additional stress caused by both the additional load and pressure. I should point out that Extra Load tires (commonly abbreviated "XL") have the same load carrying capacity as SL tires at the same pressure. It is a common misconception that XL tires must therefore have better performance than an SL tire, but in fact they would perform worse because they are thicker and would hold in more of the heat generated. But this difference is so very slight that it really doesn't make much difference. (What I am trying to say is if you don't need XL tires, then don't pay the extra money for them.) Some finer points: This curve is for the "Maximum" load. This would be for "ideal" situations - moderate heat, smooth roads, moderate speeds, minimal torque applied, driving straight ahead, etc. (Otherwise, more heat is generated in the tire structure - and heat is the tire killer.) As we all know there are no "ideal" situations (this applies to things other than just tires), so we engineers account for that by either overestimating the "load" or adding some "reserve" capacity. Because of this, it becomes the vehicle engineer's responsibility to select a tire size and inflation pressure that is appropriate for the intended "service" of the vehicle. How this is done is a trade secret for each vehicle manufacturer and I assume there is a "Design Standard" at each vehicle manufacturer, so the method isn't lost for future vehicles. I'm quite sure a smart guy can figure out what each vehicle manufacturer's "Design Standard" is, if they spend enough time at it. I should point out the obvious - It will be different for the type of vehicle - a pickup would be different that a sports car, for example. But the points I want to make are: Tire size and pressure info are vehicle specific and second guessing a vehicle engineer is not a good idea. Even after 30 years in the business, I rarely question a vehicle manufacturer's pressure recommendation. At the bottom of the load table page is a note: "See notes on page 1-34." Here is that page: |
I want to draw your attention to note #3 and the table that follows: This note means that in spite of the load curve ending at 35 (or 41 for XL) psi, it is permissible to stamp the sidewall of the tire as having a maximum inflation of 35 psi, or 44 psi or 51 psi. (41 or 50 psi for XL). If you were to dig to find the US regulation that covers what is supposed to be stamped on the sidewall of the tire (In this yearbook, it is FMVSS109, but this was superseded by FMVSS139 in 2007, but this part reads the same for both), the regulation is unclear which of those values it is supposed to be. Most everyone in the tire industry reads the regulation that either 44 psi or 51 psi is the proper value for SL tires. However, a few tire manufacturers - notably the Michelin group (Michelin, Uniroyal, and Goodrich) have interpreted this differently and read the regulation to mean that for S and T speed rated tires, 35 psi should be stamped on the sidewall, while H and higher are supposed to read 44 or 51 psi. That means for otherwise comparable tires, you will find different maximum pressures stamped on the sidewall. This means you SHOULD NOT use the pressure stamped on the sidewall as any sort of reference point, except, of course, what it says - a maximum. and there are a couple exceptions to that!! Please note that ETRTO and JATMA have similar notes in their yearbook, except that ETRTO's rated inflation pressure for SL tires is 2.5 bar (36 psi) |
 |
|
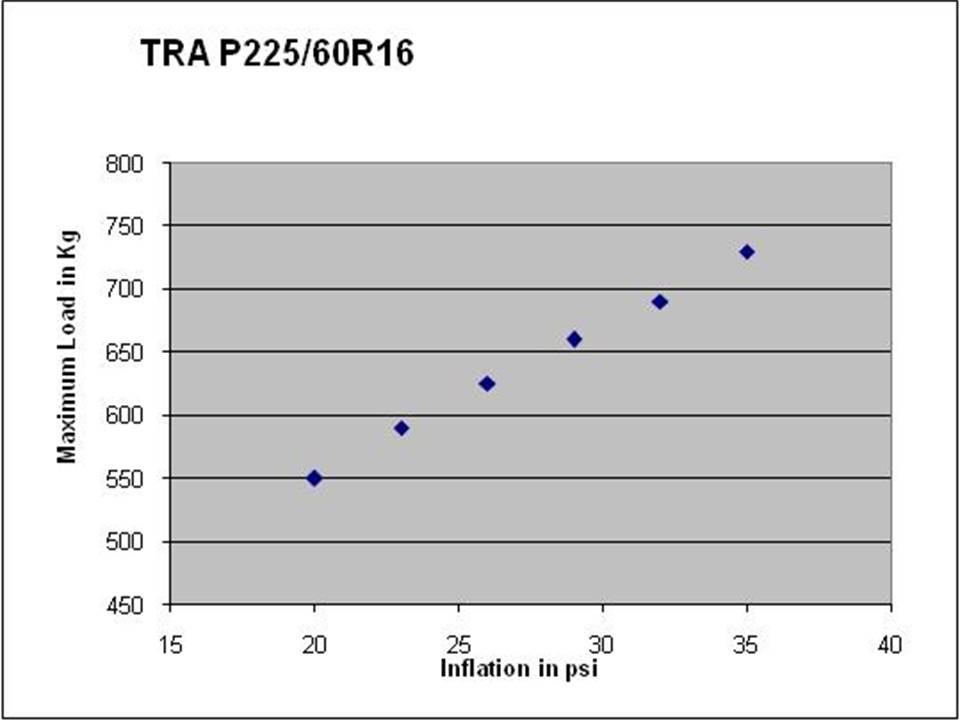
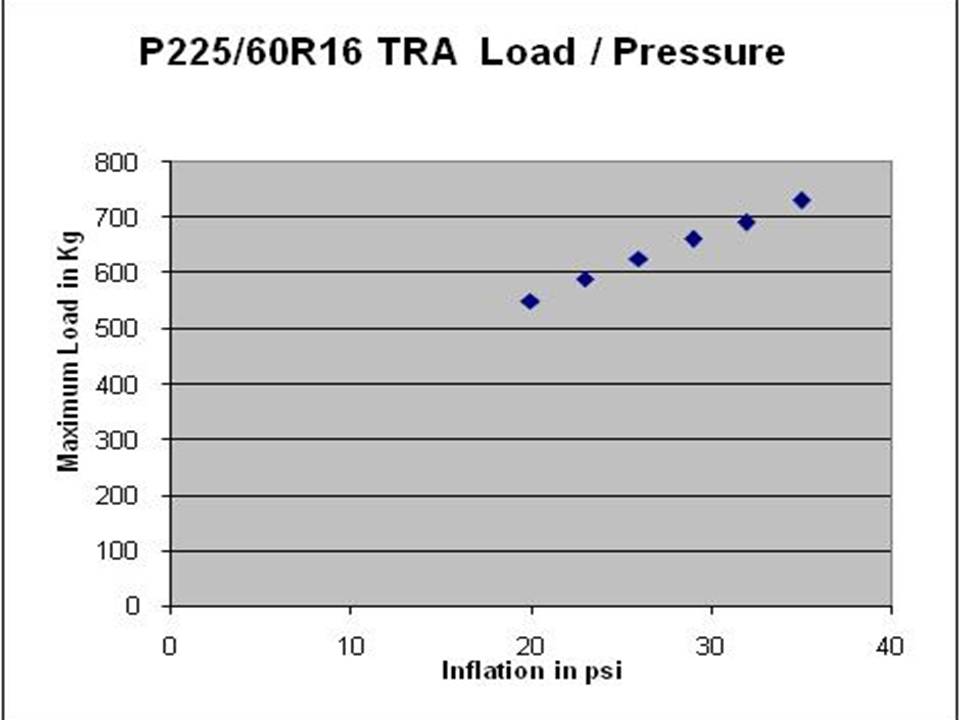
Here is a graph of the maximum load vs inflation pressure for a P225/60R16: |
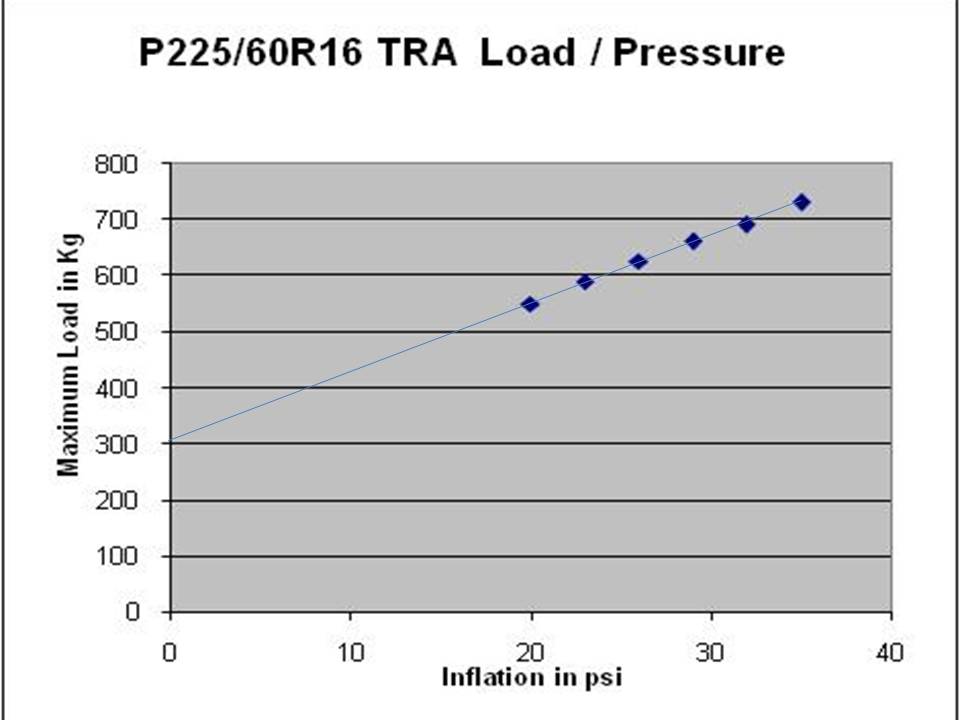
| Just the data points. | This one is with a straight line added to show that it is indeed a curve. |
 |
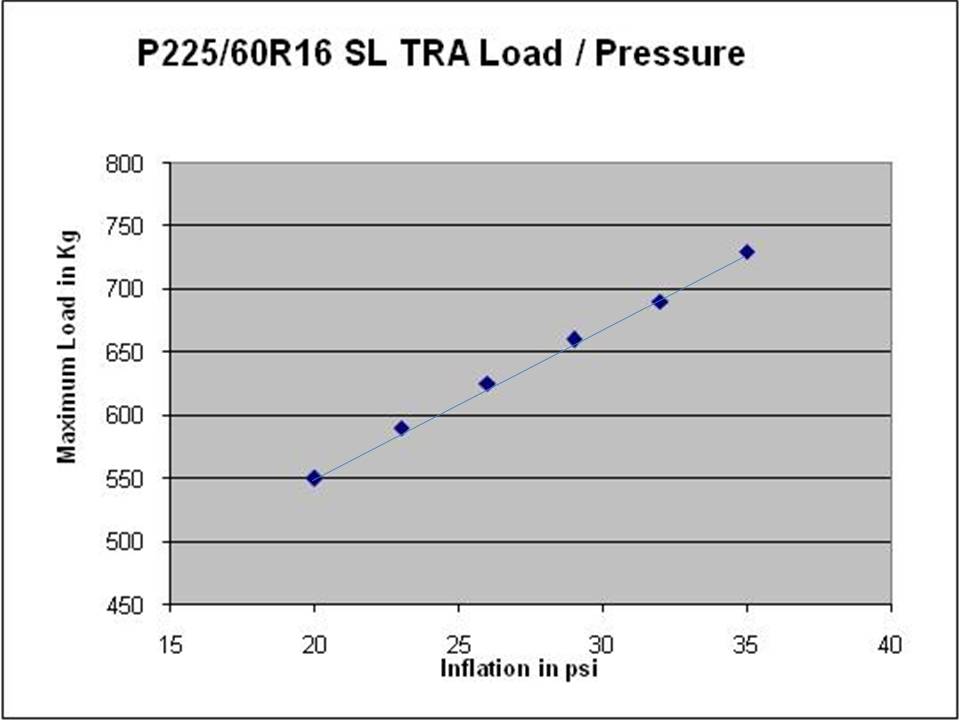 |
| And this is the graph with the origin included. | And with the straight line added to show that the load curve isn't a straight line through the origin. |
 |
|
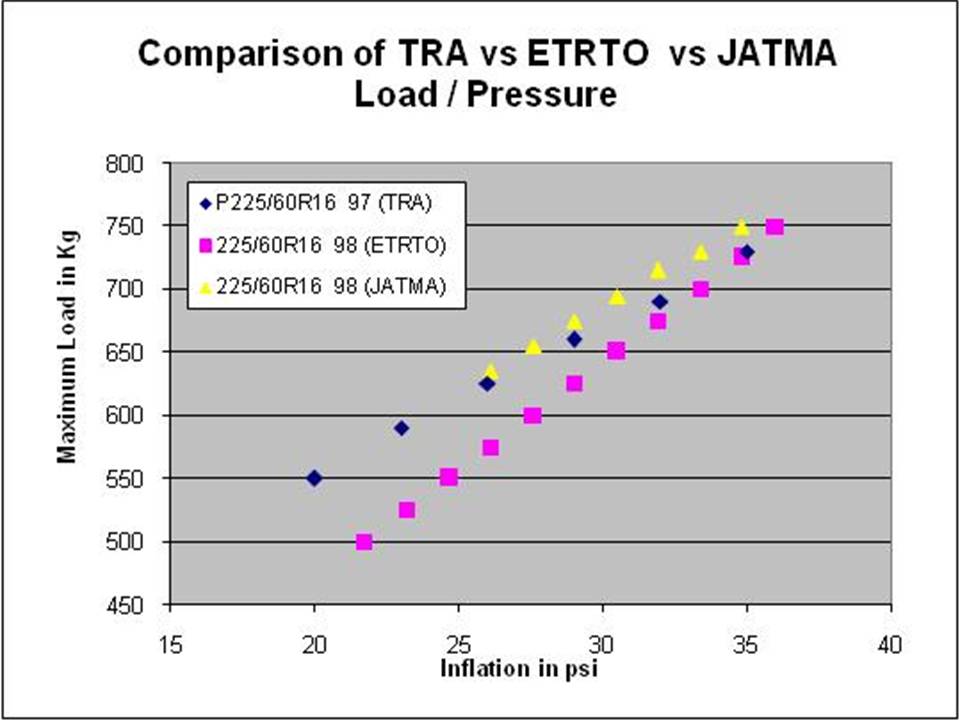
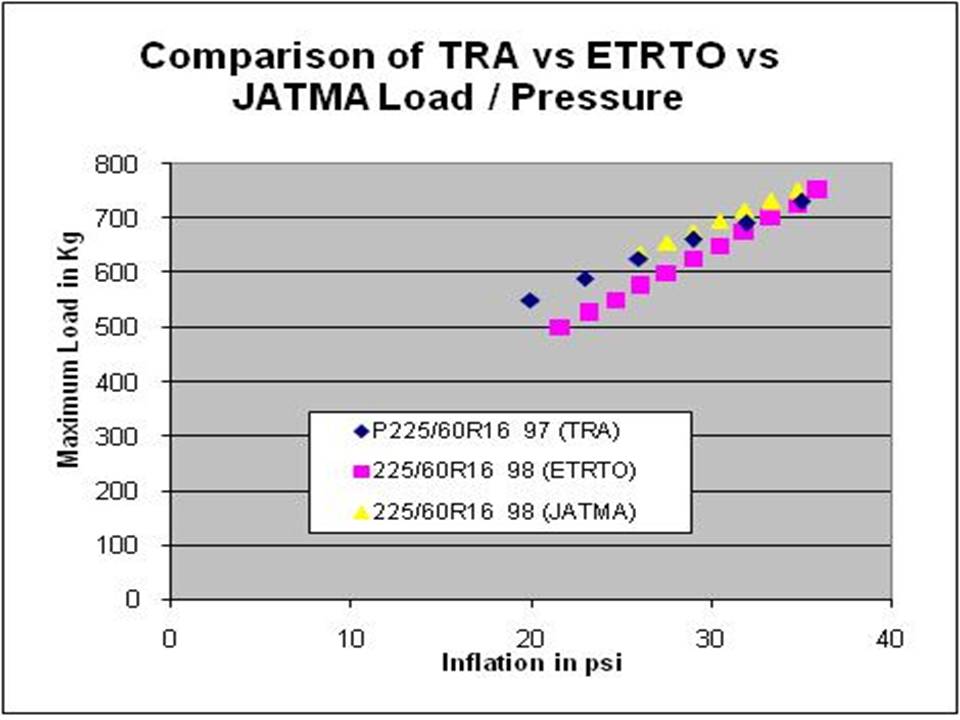
Now I am going to confuse matters a bit: This graph is all three tire standardizing organizations plotted together for the same "size". |
| Just the data points. | This one is with straight lines added to show that they are indeed curves |
 |
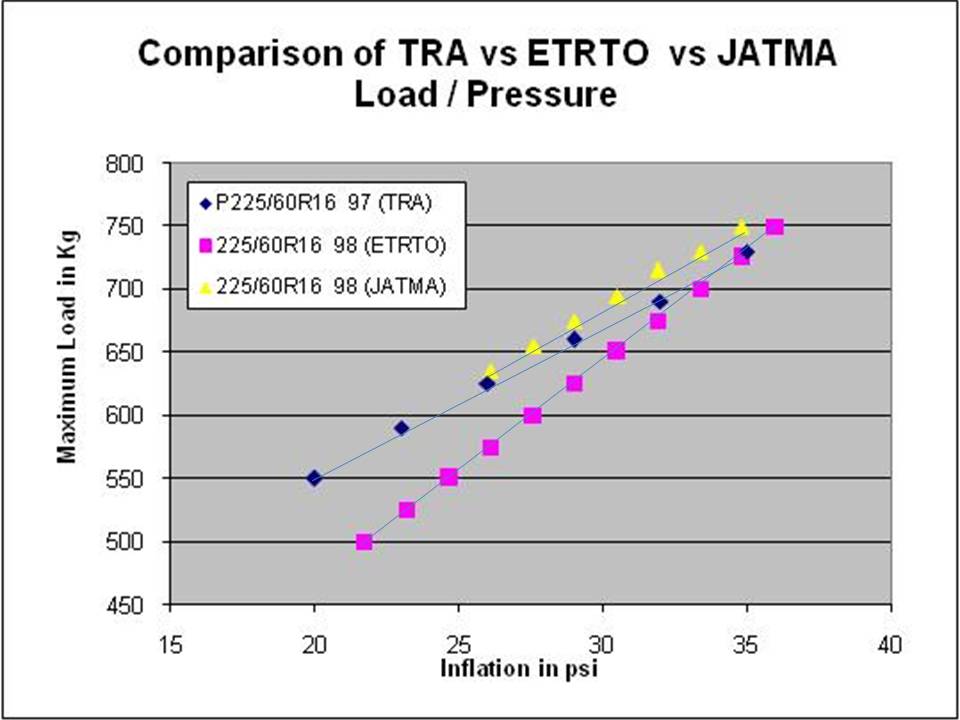 |
And this is the graph with the origin included. |
And with straight lines added to show that the load curves don't go through the origin. |
 |
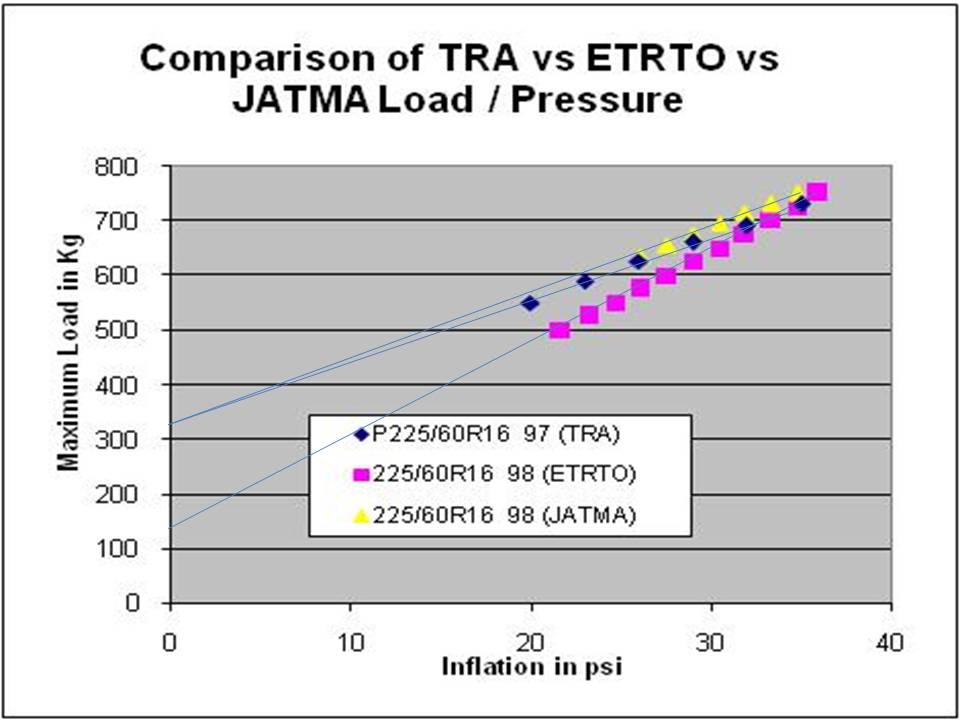 |
Notice that TRA and JATMA are pretty close. Also notice that all 3 are really close at the rated load / rated inflation pressure - even though they disagree about exactly what that point is. Lastly, notice that ETRTO has a significantly different curve than the other 2. Why the differences? Each organization is working from a different formula that was derived from a slightly different theoretical analysis of how and why tires do what they do. Obviously the European's formula results in a more conservative value at lower pressures, but, again, the values at the rating point are very close. What this means is that European cars should use larger tires, except when the inflation is specified near the rating point. |
| Side Note: |
Remember when I said that each vehicle manufacturer had its own design standard for tires? I'll bet if you were to do an analysis of European cars, the difference in what their methodology is such that they wind up with very close to the same size as the Japanese and Americans. |
|
From a tire's perspective it doesn't matter which organization's curve is used, the tire construction is going to be the same. Please note I am not saying that different manufacturers will have EXACTLY the same construction, but they are surprisingly close. What the average person should take from this is that while there are slight differences, for practical purposes it doesn't matter who manufactures the tire, if the size is the same, then from a load carrying capacity point of view, it can be used interchangeably. I should point out that a tire manufacturer is under no obligation to exactly follow any particular tire load standard, but it would be kind of foolish NOT to do so since the vehicle manufacturers use these load standards when selecting tire sizes and inflation pressures. |
| Another Side Note: |
Sharp eyed readers will have noticed that I've mixed English units (psi - pounds per square inch) with SI units (kg - kilograms). This was done simply for convenience as I already had more than half the data tabled this way. However, this does not change the conclusions. |
Barry's Tire Tech - Tire Standardizing Organizations Barry's Tire Tech - Load Tables Barry's Tire Tech - Dimension Tables Barry's Tire Tech - Rolling Resistance and Fuel Economy |