|
B arry's
Tire
Tech This is a series of articles on the technical aspects of tires, their care and usage. My primary purpose in these articles is to help people understand tires and thereby reduce the risks we all face every day. ..........and since tires is just about the only thing I know about.......... Please drop me a note if you have a topic you want to see: Barry@BarrysTireTech.com |
|
SAE Paper 800087 - The Effect of Inflation Pressure on Bias, Bias-Belted, and Radial Tire Performance - by B. L. Collier and J. T. Warchol, B. F. Goodrich, February, 1980 : |
|
This is a paper presented in the 1980 SAE Congress and Exposition in Detroit. Some Historical Background: In 1980, BF Goodrich was a separate tire manufacturer. The company merged with US Royal (Uniroyal) in 1986 and in 1988, Michelin purchased the merged tire companies. Please note: The Goodrich name continues as both a tire brand (wholly under the control of Michelin), and a separate (non-tire) company involved in Aerospace. It is my understanding that copyright laws prevent me from publishing the entire document, but I am allowed to post excerpts with the intent to educate - so I will only give a summary of the parts of the study that will be of interest. Please note: I am going to show results for each test conducted - regardless of what the results were - in other words a full disclosure - no hidden agenda. This study involved G78-15 size tires of the 3 types mentioned in the title - bias, bias-belted and radial. This sizing is called AlphaNumeric. The modern equivalent would be P215/75R15. What's most important here is that the rated pressure for AlphaNumeric tires was 32 psi - and the study tested tires at 16, 24, 32, 40, and 48 psi. I assume they chose 8 psi increments because they were multiples of 32 psi and because the wear testing was conducted at 24 psi (more on that later). Also important to note is that P metric tires use 35 psi as the rated pressure. For those who don't know, the maximum load carrying capacity of a tire varies with size and pressure. For a given tire size, the load carrying capacity goes up as the pressure goes up - until the maximum - which is commonly called the rated load. The corresponding pressure is commonly called the rated pressure. For a more complete discussion on load vs pressure, see: Barry's Tire Tech - Load Tables They tested the rolling resistance of these tires, but I'm not going to show that because the results are pretty much what has been published here:Barry's Tire Tech - Rolling Resistance and Fuel Economy - more pressure reduces RR and the effect slows down the more pressure you put in (for the same load). |
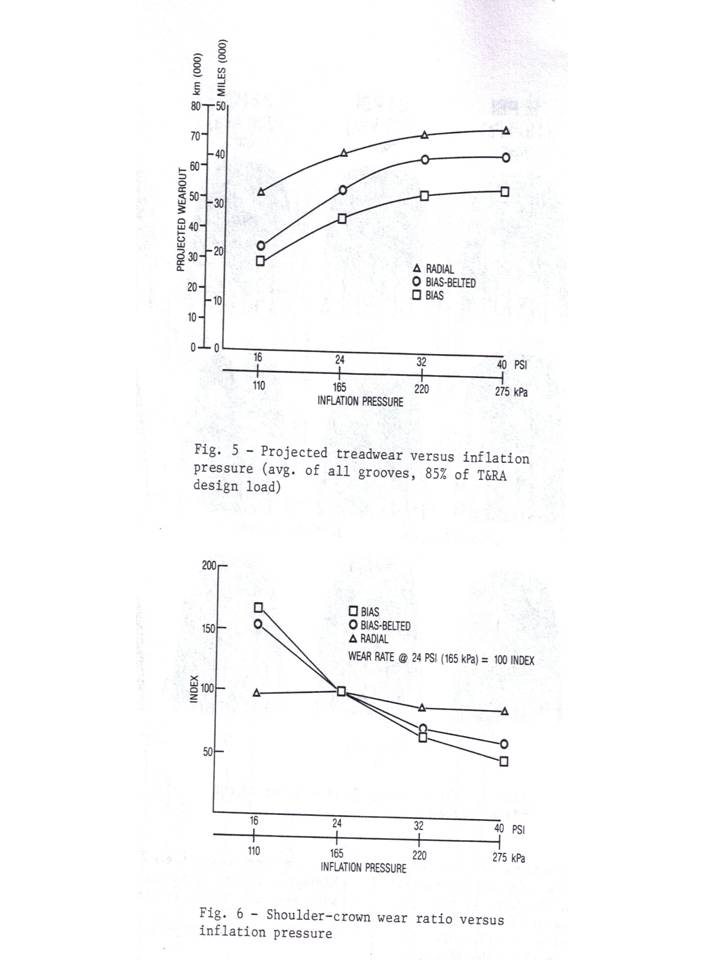 |
Wear Test:They conducted a 13,600 mile on-vehicle wear test and projected the wearout mileage. The increased pressure resulted in increased mileage projection - again the effect slowed down as the pressure increased.
Please note: they tested the tires at 85% of the rated load. I looked this up and 85% rated load corresponds to 24 psi - which explains why they used 24 psi for the index. I should also point out that at 40 psi, the bias ply tire was showing cords at the end of the test, and that's probably why they did not conduct the wear test at 48 psi.
I hope you noticed how flat the wear index is for the radial tire. I interpret this to mean that conducting a "chalk test" is not a good way to determine what the best pressure is for wear. Put another way - Radial tires are pretty insensitive to pressure when it comes to wear pattern. |
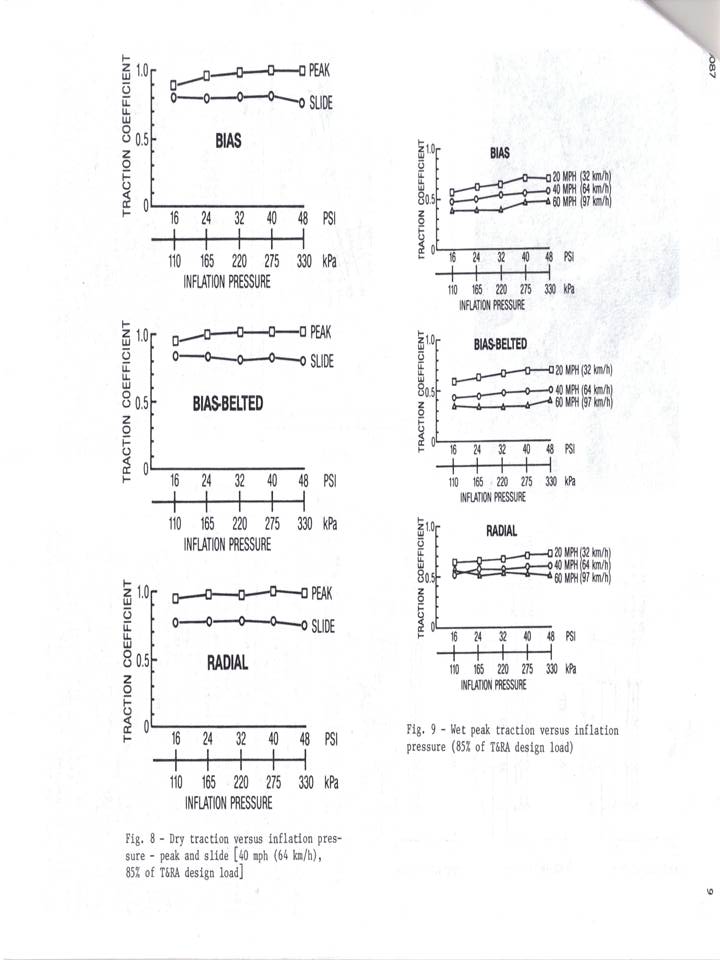
Dry Braking & Wet Braking: Both of these tests were conducted using a traction trailer - pulled behind a truck. A brake is gradually applied to the test position on the trailer until the tire locks up and instrumentation on the axle measures the peak torque and then the stabilized slide value. For the wet portion of the test, water is sprayed on the ground in front of the tire at a prescribed rate. This generates a consistent water depth. This is a common way to conduct traction testing. These results are a surprise to me. Given the results of the wear test, I would have expected the traction values to peak at some pressure and then drop. Perhaps it is the nature of the braking test and perhaps a different set of values would have been obtained if a test had been conducted on a circular skid pad using a vehicle - but they didn't do that, so we don't know. |
|
|
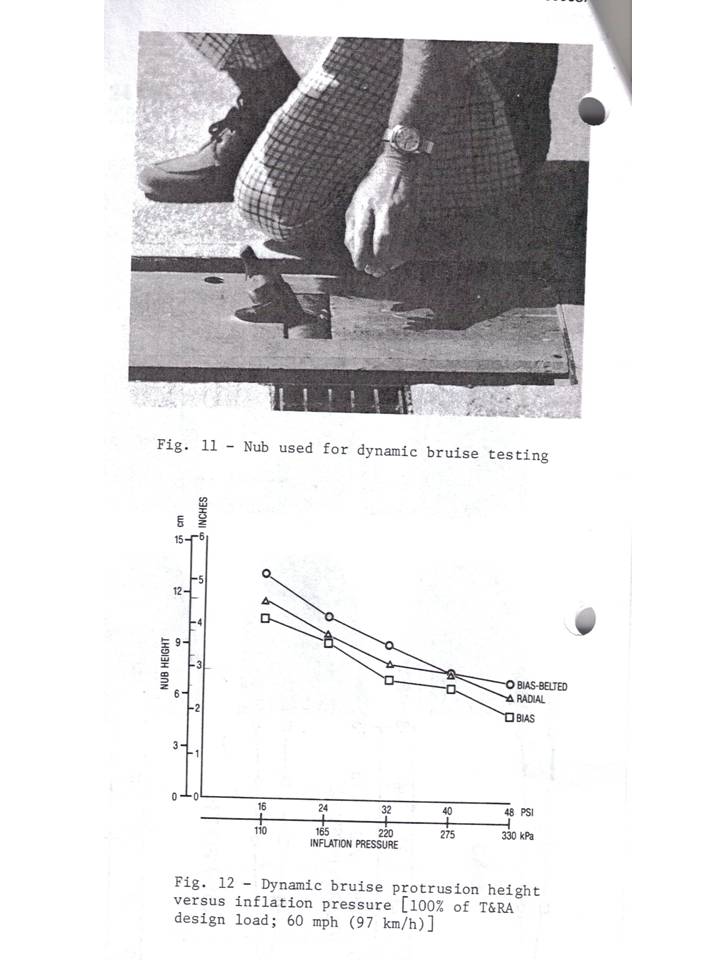
Dynamic Bruise Resistance: This was an on vehicle test conducted by driving a tire at a constant speed over a probe. If the tire did not experience a blowout, the probe was raised 1/8" and the test was run again - until there was a blowout. The values shown are the average of 4 tires. I note with interest that none of the curves is what you would call "smooth". They all seem to jump around bit. I suspect that part of this is the nature of the test - and that part of this is variability of the data. But it is obvious that when the inflation pressure goes up, the ability for a tire to endure an impact goes down. But if I read the values just as they are published, then the radial tire experienced a 30% loss of height when going from 32 psi (the rated pressure) to 48 psi. |
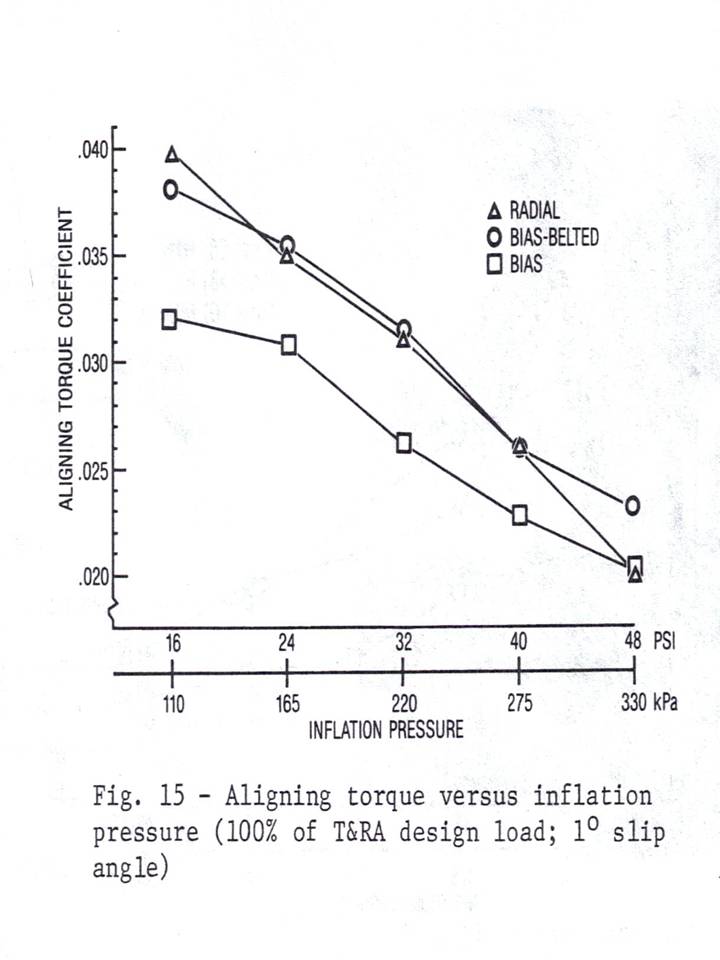
Force and Moment: This is a lab test. The equipment is specially designed to do this work. They published the result for only 2 parameters at one slip angle. This is unusual because normal force and moment testing results in quite a lot of data. I suspect they performed this abbreviated test because they knew that they would be presenting this data to vehicle manufacturers - who knew that increased inflation pressure would result in increased tire spring rate - and THAT would mean a complete redesign of the suspension spring rates, the shock dampening, etc. - so they generated only enough data to get the 2 parameters that would be of interest to suspension engineers. The first parameter they looked at was cornering coefficient - and all that yielded was that increasing pressure resulted in a quicker responding tire - well, duh!! But the second one is interesting - Aligning Torque: |
Aligning torque is what you feel when you turn the steering wheel and it returns on it's own (OK, it's a bit more complicated than that, but for the purposes of this critique, that's good enough.) Low values in aligning torque make the car feel "vague" when driving straight (Ride engineers call this "On Center Feel") - and one of the results is that it makes the tire more susceptible to groove wander - which has been reported by folks using elevated inflation pressures. |
 |
| Summary: Rolling Resistance: More pressure reduces RR but the effect diminishes. Wear: More pressure is better, and the evenness of wear for a radial tire is largely unaffected, but the wear rate effect diminishes as the pressure goes up. Braking Traction: Dry traction is unaffected by inflation pressure, and while wet traction is improved, the effect is small. Dynamic Bruise: More pressure is worse. Force and moment: Cornering correfficient goes up, aligning torque goes down. Editorial Comments: I am a little disappointed in this paper. I would have liked to seen: Regular Plunger Energy: I suspect the authors did not do that because it is well known that PE goes down with pressure increases. However, it would have been interested to see if PE followed the decrease in plunger height, particularly since the data presented seems to jump around a bit. Since PE is a lab test - and more highly controlled - the PE data might have given better definition of what happens at the higher pressures. In particular, I wonder if the values would also show a decreasing effect as inflation pressure inceased. Ride: I suspect the authors didn't do this because they knew that increasing inflation pressure increases ride harshness and that could be compensated for - at least partially - by careful selection of vehicle spring rates and the shock's damping coefficients. Further, I suspect the authors saw their audience as the vehicle manufacturers, so the authors knew that they would know this, too! Vehicle Dry Handling: On a smooth handling track, I suspect the results would have shown a slight increase in handling with increases in inflation pressure, but there might have been a point where the spring rate of the tire (which would increase as the inflation pressure went up) would have caused the tire to unload over a bump (maybe even leaving the road surface) and that would cause the handling to peak, and then go down. This would obviously be worse the more bumpy the track was. Most handling tracks are fairly smooth - unlike the real world - and the results would have been highly dependent on the bumpiness of the track. Vehicle Wet Handling: Here is where I would have expected the inflation pressure increase to show some dramatic losses. I was surprised by the braking traction results - very flat - and I suspect that this would not have translated into the same result when applied to a vehicle (except for straight line braking). But just like for dry handling, this would have been highly dependent on the bumpiness of the track surface. But on a whole, this paper seems to point towards increasing inflation pressure is better for many properties, the effects are fairly small, and the ones that aren't better might be compensated for by changes in the vehicle suspension. The only thing that points towards a significant safety issue is the plunger energy - and while this is a relatively rare occurrence, the results of a tire failure due to an impact can be quite severe. I wish there were better statistics on accidents involving impacts so this could be better assessed. |
|
|